This image of M8, the Lagoon Nebula represents something new. Narrowband imaging has some disadvantages (like longer exposure times, specificity on objects that emit instead of reflect light, what restricts its use to mainly emission and planetary nebulas) but also many advantages, like crispier images (due to its higher contrast, compared to RGB), and very specifically that they reveal the composition of the nebula. By carefully mapping the colors to be assigned to each filter, we can trace the distribution of each main element in the nebula: Hydrogen, Oxygen and Sulphur. Narrowband imaging became popular ever since the famous “Pillars of Creation” imaged by the Hubble Space Telescope was published. The so called “Hubble Color Palette” (or HCP) effectively reveals differences in composition, at the cost of showing the nebula in weird colors that (even helping us detect a lot of detail) look totally different when compared to the RGB colors that we are used to. An HCP colored version of this nebula can be found here.
One of my goals when imaging through narrowband filters has been always to try to represent the nebula (taking advantage of its crispier detail) but in “natural” color, in contraposition to the “false” color shown when the HCP is used to map the colors. Some examples can be seen in this web site, like the previously mentioned M8 (https://astrodrudis.com/m-8-ngc-6523-new/). Other attempts to get a natural color but revealing more information about the composition and intensity of the nebula were made in the last weeks, with the best example of this in the Tarantula Nebula, an image selected as APOD last November 8, 2016.
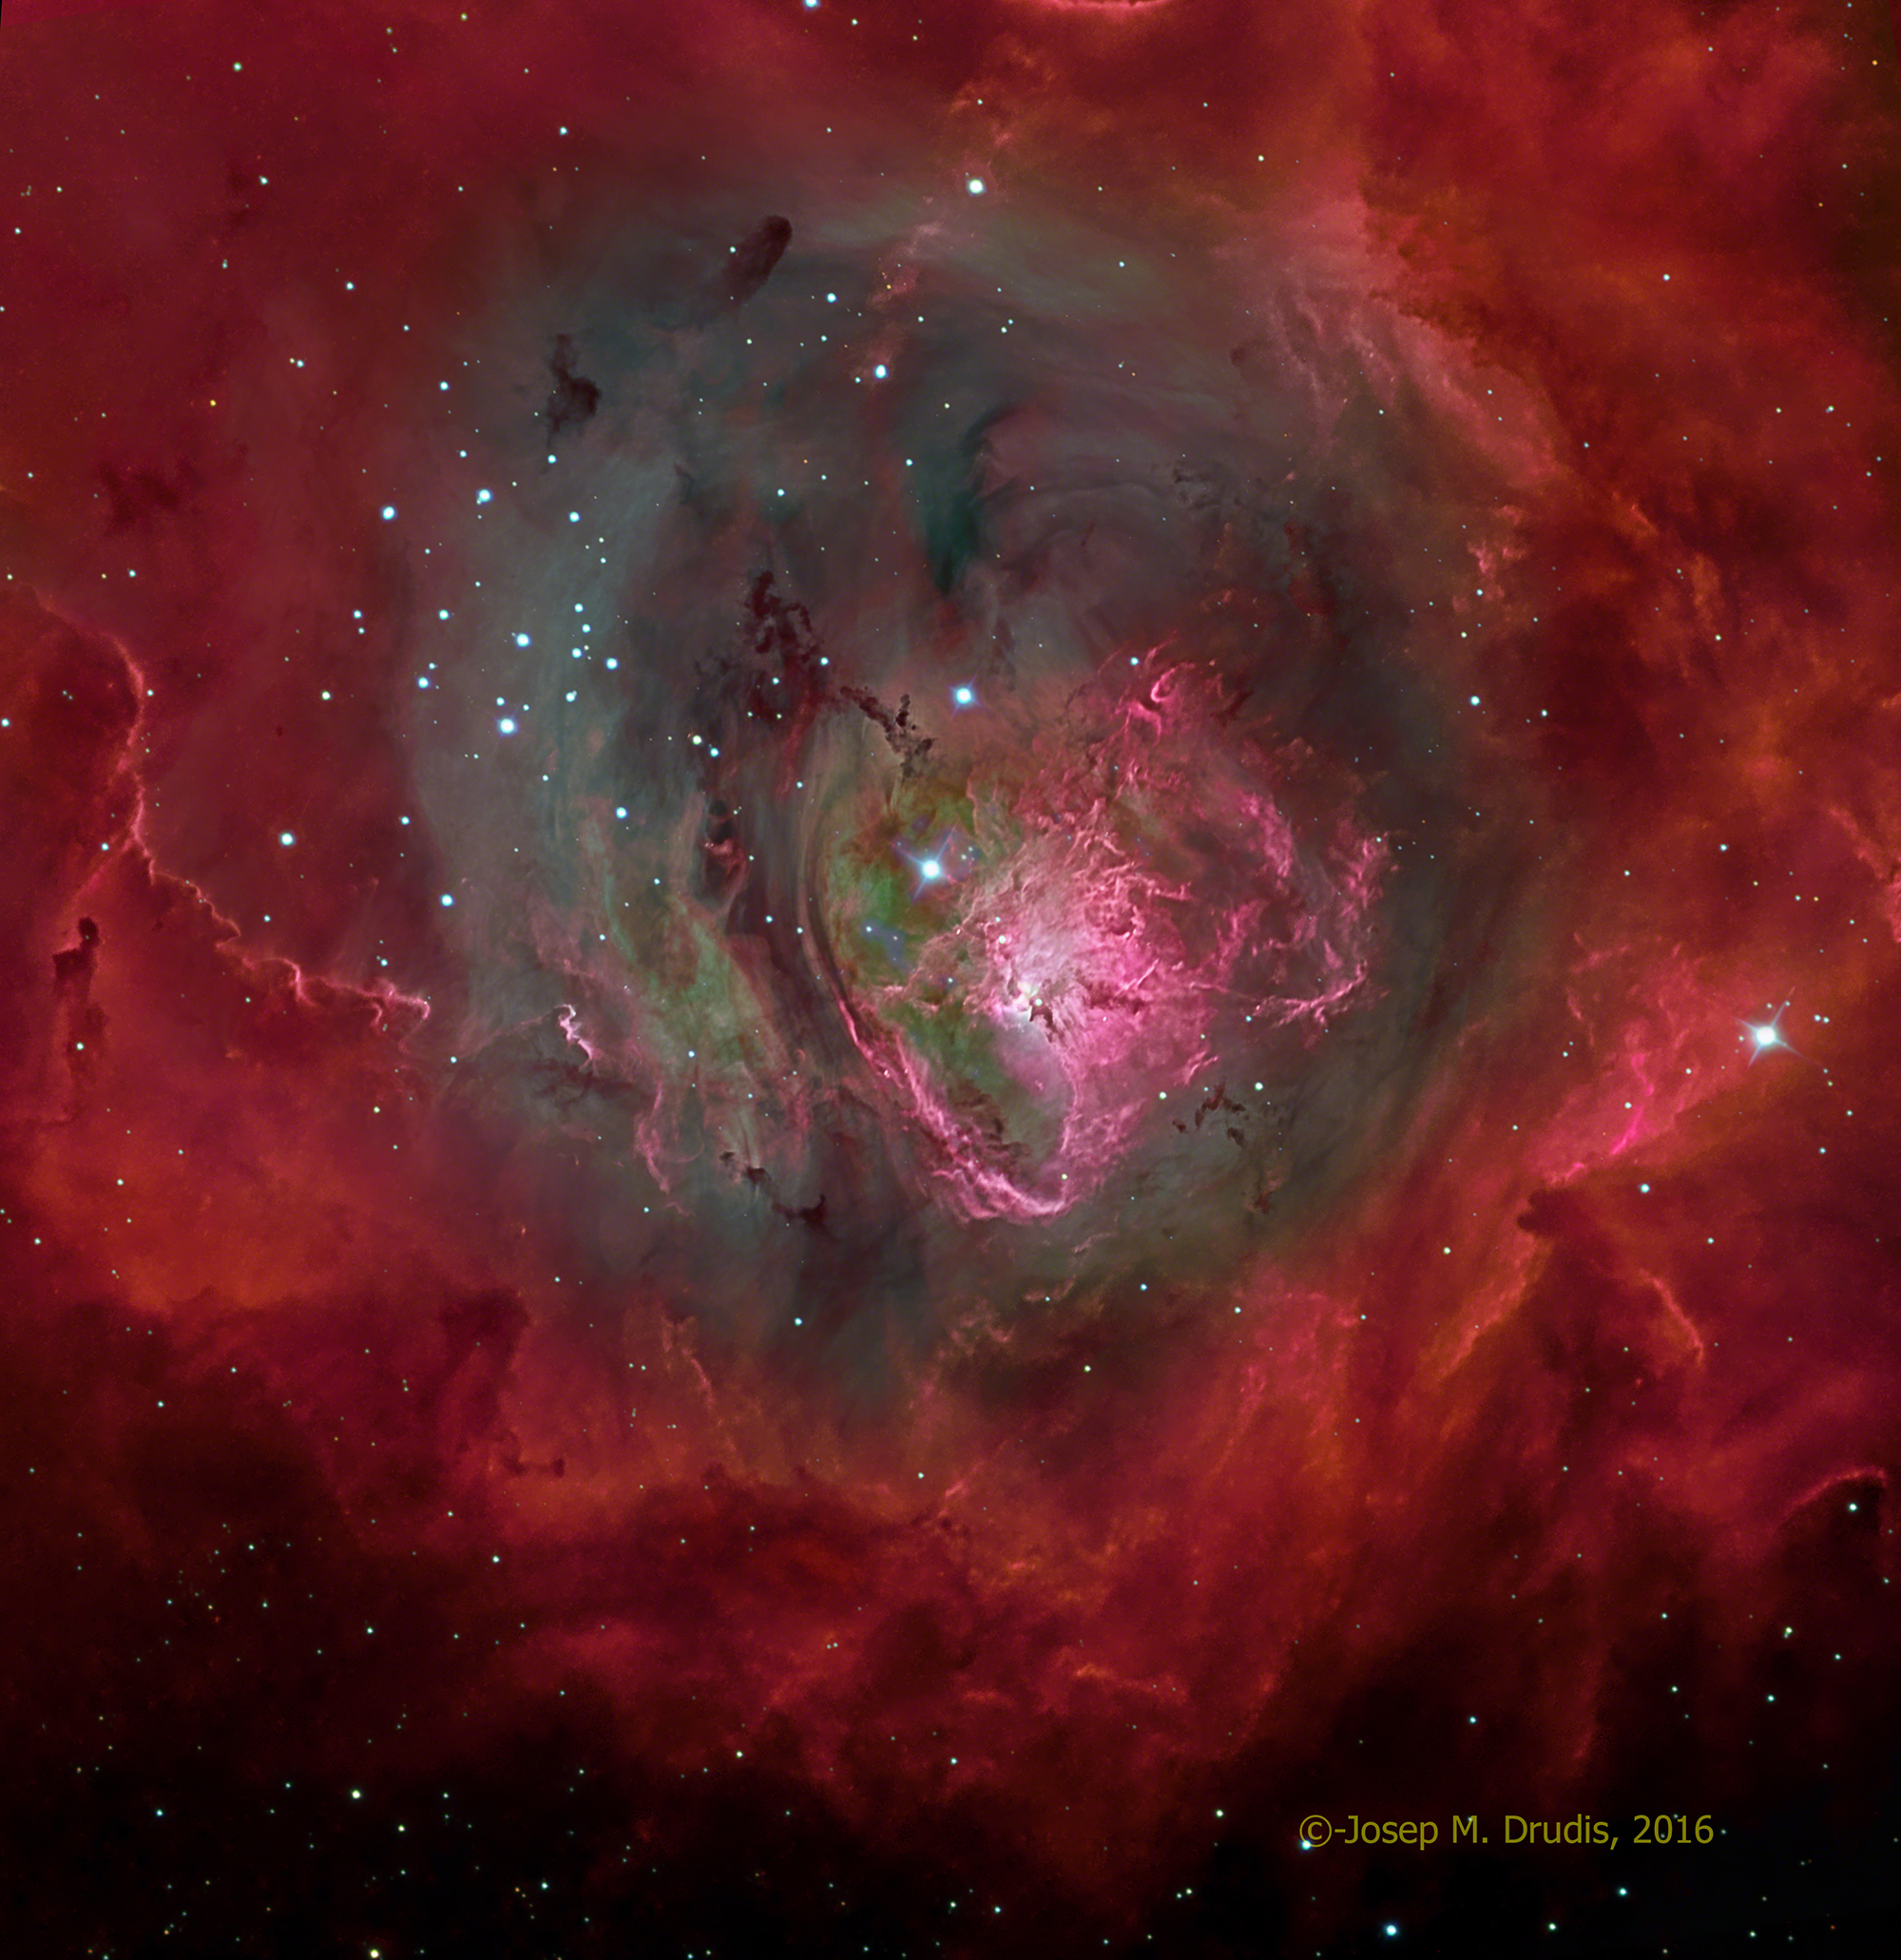
This image of the Lagoon Nebula has been processed in a way as to reveal its qualitative composition (H, O, S) as well as its semi-quantitative composition. The means to do this is to deconstruct each master (Ha, OIII and SII) into different layers as a function of the image density. This way, instead of combining three masters to get the color image, the number of layers rises to 19. The three main filters have been mapped to colors close to their “natural” wavelengths (Ha-Magentaish-Red, OIII-Greenish-Blue, SII-Orangish-Red), but each layer has been mapped to different colors revealing differences in the amount of each gas. For Ha, the basic color is Red with a hint of blue (for Hbeta), but the layers with increasing Ha-signal are mapped to more Magenta and the highest concentration corresponds to Pink. For OIII, the increasing signal is mapped towards Blue and increasing SII signal deviates the color to Orange.
This one is the first image processed with this method, but it won’t be the last one. The number of hours needed to process an image following this method is higher, but the image contains a bit more information.
The details of how this image was taken can be found at https://astrodrudis.com/m-8-ngc-6523-new/.